A candlestick chart is a type of financial chart used to represent the price movement of an asset over a specific period. Each candle on the chart provides a visual summary of price data, showing the open, high, low, and close prices of an asset within that specific candle interval.
In this article, we will build an interactive web app that plots candlestick charts using the TradingView Lightweight Charts library and the CoinGecko API for our historical dataset.
Requirements
To replicate a modern production environment, we'll build our application with SvelteKit. This user-friendly framework has everything we need to develop and deploy an interactive web application.
Here is everything you’re going to need:
- Node.js and npm
- An IDE
- Some TypeScript knowledge (optional)
- Some TailwindCSS knowledge (also optional)
- A CoinGecko Demo API Key
You can access CoinGecko’s Demo API for free, but please note that it only provides historical data for up to 365 days and offers limited interval options.
To get started, create your CoinGecko account, head to the Developers’ Dashboard, and click on '+Add New Key' to generate a new API Key.
Configuring Your Project
After installing node.js, the first thing we want to do is create a new SvelteKit project.
The easiest way to do that is to create a root directory for your project and then run the command npx sv create from your command prompt or terminal window, from within your directory.
Next, you’ll be presented with a series of configuration options for your SvelteKit Project. Feel free to configure these to suit your coding preferences, or use the following settings to replicate our configuration:
Where would you like your project to be created? => Hit Enter
Which template would you like? => Select SvelteKit minimal
Add type checking with Typescript? => Select Yes, using Typescript syntax
What would you like to add to your project? => Use the Arrow keys and Space to select Prettier, eslint and TailwindCSS
Which package manager do you want to install dependencies with? => Select npm (if not already selected)
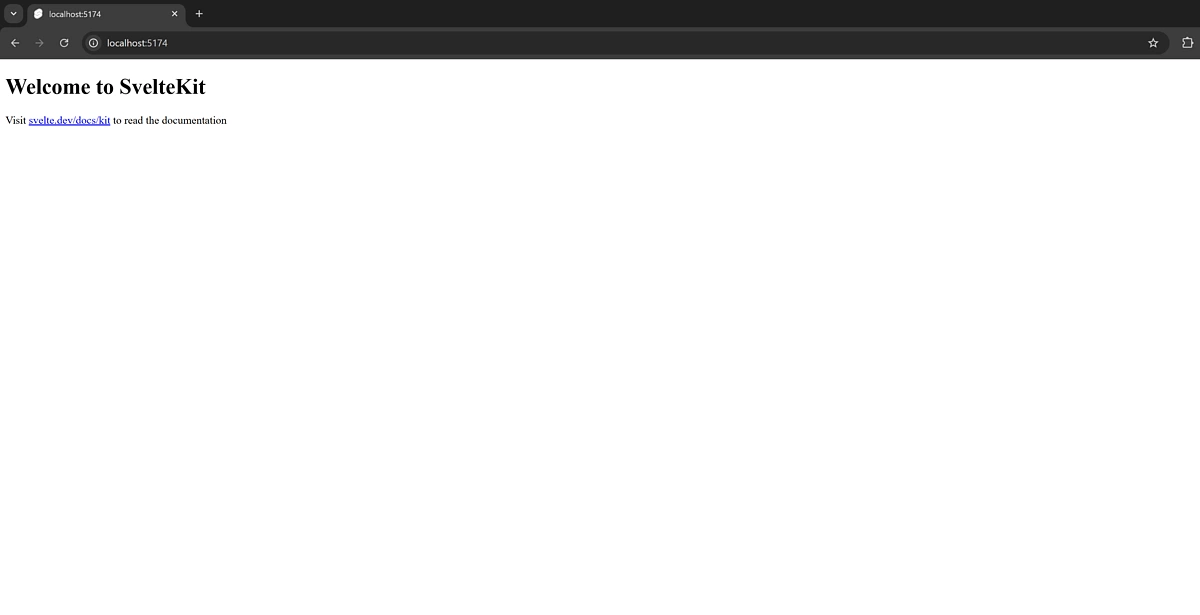
You should now be able to navigate to your website’s homepage if you go to http://localhost:5173/
Finally, let’s install the charting library that we’ll be using:
npm install lightweight-charts
Step 1: Safely load our API key
Let’s create a .env file inside our project’s root directory. Since we’re working within a web environment, we must ensure that only the server can access this information.
Inside your .env file, go ahead and save your API Key like so:
CG_API_KEY = "YOUR API KEY"
API_TYPE = "DEMO"
This will enable us to load it on the server side later on safely.
Step 2: Defining our data types
Inside the src/lib directory, create a subdirectory called types. Inside types, we’ll create a PriceData.ts file defining the data type that we’ll be expecting from CoinGecko’s endpoint Coin OHLC Chart by ID.
Tradingview’s lightweight-charts expect the historical data to be a list of objects, so we’ll need to define both types:
import type { UTCTimestamp } from 'lightweight-charts';

type Candle = [time: UTCTimestamp, open: number, high: number, low: number, close: number];
type CandleObject = { time: UTCTimestamp; open: number; high: number; low: number; close: number };

export type CandleArray = Candle[];
export type CandleObjectArray = CandleObject[];
Next, navigate to the src/lib directory and create a new subdirectory called enums. Inside this directory, we'll define a new file named VsCurrencyEnum.ts
In this enum, we'll store all the valid options for the vs_currency parameter used in our historical data queries.
CoinGecko's historical data endpoint expects a vs_currency parameter, allowing us to retrieve asset prices in a currency of our choice. For example, passing 'usd' when querying Bitcoin's historical data will return the BTC/USD dataset.
export enum Currency {
	BTC = 'btc',
	ETH = 'eth',
	LTC = 'ltc',
	BCH = 'bch',
	BNB = 'bnb',
	EOS = 'eos',
	XRP = 'xrp',
	XLM = 'xlm',
	LINK = 'link',
	DOT = 'dot',
	YFI = 'yfi',
	USD = 'usd',
	AED = 'aed',
	ARS = 'ars',
	AUD = 'aud',
	BDT = 'bdt',
	BHD = 'bhd',
	BMD = 'bmd',
	BRL = 'brl',
	CAD = 'cad',
	CHF = 'chf',
	CLP = 'clp',
	CNY = 'cny',
	CZK = 'czk',
	DKK = 'dkk',
	EUR = 'eur',
	GBP = 'gbp',
	GEL = 'gel',
	HKD = 'hkd',
	HUF = 'huf',
	IDR = 'idr',
	ILS = 'ils',
	INR = 'inr',
	JPY = 'jpy',
	KRW = 'krw',
	KWD = 'kwd',
	LKR = 'lkr',
	MMK = 'mmk',
	MXN = 'mxn',
	MYR = 'myr',
	NGN = 'ngn',
	NOK = 'nok',
	NZD = 'nzd',
	PHP = 'php',
	PKR = 'pkr',
	PLN = 'pln',
	RUB = 'rub',
	SAR = 'sar',
	SEK = 'sek',
	SGD = 'sgd',
	THB = 'thb',
	TRY = 'try',
	TWD = 'twd',
	UAH = 'uah',
	VEF = 'vef',
	VND = 'vnd',
	ZAR = 'zar',
	XDR = 'xdr',
	XAG = 'xag',
	XAU = 'xau',
	BITS = 'bits',
	SATS = 'sats'
}
To fetch all valid base assets, you can use a tool like Postman to make an authenticated request to /simple/supported_vs_currencies and save it inside the Currency enum. Another option would be to use the getVsCurrencies() method that we’ll be defining inside our main CoinGecko class down below.
However, if you prefer to keep it simple, you can manually define the base pairs that are relevant to you.
Step 3: Fetching historical data
Next, let's return to the lib directory and create a new subdirectory called providers. Inside providers create a file named PriceDataProvider.ts.
Here we'll handle all our CoinGecko API calls. To keep the code organized, we'll define a CoinGecko class that will contain the various methods for interacting with the API:
import { Currency } from '$lib/enums/VsCurrencyEnum';
import type { CandleArray, CandleObjectArray } from '$lib/types/PriceData';
import type { UTCTimestamp } from 'lightweight-charts';
import { env } from '$env/dynamic/private';

class CoinGecko {
	private root: string;
	private headers: Record;

	constructor(apiKey: string) {
		this.root =
			env.API_TYPE === 'DEMO'
				? 'https://api.coingecko.com/api/v3'
				: 'https://pro-api.coingecko.com/api/v3';
		const auth_param = env.API_TYPE === 'DEMO' ? 'x-cg-demo-api-key' : 'x-cg-pro-api-key';

		this.headers = {
			accept: 'application/json',
			[auth_param]: apiKey
		};
	}

	async getHistoricalData(
		coinId: string,
		days: string,
		vsCurrency: Currency = Currency.USD
	): Promise {
		const requestUrl = `${this.root}/coins/${coinId}/ohlc?vs_currency=${vsCurrency}&days=${days}`;
		const response = await fetch(requestUrl, { headers: this.headers });
		const data: CandleArray = await response.json();

		return data.map(([time, open, high, low, close]) => ({
			// millisecond timestamp not supported so we convert to seconds
			time: (time / 1000) as UTCTimestamp,
			open,
			high,
			low,
			close
		}));
	}

	async getVsCurrencies(): Promise {
		const requestUrl = `${this.root}/simple/supported_vs_currencies`;
		const response = await fetch(requestUrl, { headers: this.headers });
		return await response.json();
	}

	async getCoinIdByName(coinName: string): Promise<{ id: string; symbol: string; name: string }[]> {
		const requestUrl = `${this.root}/coins/list`;
		const response = await fetch(requestUrl, { headers: this.headers });
		const data = await response.json();

		return data.filter(
			(coin: { id: string; symbol: string; name: string }) =>
				coin.name.toLowerCase() === coinName.toLowerCase()
		);
	}
}

export default CoinGecko;
The constructor in our CoinGecko class utilizes two ternary operators for this root and auth_param, allowing us to switch between the Demo and Pro API Keys easily. By replacing the Demo key with a Pro key in our .env file and setting the API_TYPE variable to "PRO", our class constructor logic will automatically handle the rest when the app is restarted or hot-reloaded.
The getHistoricalData() method is the core function responsible for fetching the candlestick data. It takes three parameters and returns an object of type CandleObjectArray, which we defined in PriceData.ts.
Here's how it works: We make a request to the CoinGecko API (either the demo or pro version) using the coinId, vs_currency, and days parameters
${this.root}/coins/${coinId}/ohlc?vs_currency=${vsCurrency}&days=${days}
After receiving the response, we map the object (which is typically a list of lists) to a list of objects so that we can pass the historical data to the TradingView charting library.
One important detail here is the timestamp conversion:
time: (time / 1000) as UTCTimestamp
The timestamp we receive from the API is in milliseconds, which causes issues with the chart rendering. By dividing it by 1000, we convert it to seconds, ensuring the chart displays correctly.
Next, we have the getVsCurrencies() and getCoinIdByName() methods. While not actively used in our current code, they are helpful utilities for fetching and storing relevant data.
For example, getVsCurrencies() can be used to populate the Currency enum in VsCurrencies.ts, while getCoinIdByName() helps us obtain the API ID for a coin based on its name.
Since the historical data API requires a coinId rather than a symbol or name, we may need to periodically call getCoinIdByName() to determine a coin's correct ID
Step 4: Accessing The data inside our app
Now that we’ve successfully integrated the CoinGecko API, we need to connect it to our front end to interact with the data through a simple web interface. Thankfully, this is straightforward to set up in SvelteKit.
To start, navigate to src/routes and create a new file called +page.server.ts. Unlike other frameworks, SvelteKit follows a standardized file naming convention for Svelte-specific files, such as the one we just created.
import CoinGecko from '$lib/providers/PriceDataProvider';
import { error } from '@sveltejs/kit';
import { env } from '$env/dynamic/private';
import type { PageServerLoad } from './$types';

const cg = new CoinGecko(env.CG_API_KEY ?? '');

export const load: PageServerLoad = async (request) => {
	const searchParams = new URL(request.url).searchParams;
	const coin = searchParams.get('coin');
	const days = searchParams.get('days');

	try {
		const chartData = await cg.getHistoricalData(coin?.toLowerCase() ?? 'bitcoin', days ?? '7');

		if (!chartData || chartData.length === 0) {
			// If no data is found, return a 404 error
			throw error(404, 'Not found');
		}
		return {
			chartData
		};
	} catch (err) {
		console.error(err);
		throw error(500, 'Error fetching chart data');
	}
};
Inside this server file, we’ll export a function named load, typed as PageServerLoad. This is a SvelteKit default method that allows us to make its return value accessible on the webpage.
To ensure a smooth start-up, we’ll set it to load a 7-day Bitcoin chart by default if no parameters are provided. These parameters will be specified in the URL, for example:
?coin=bitcoin&days=14
Step 5: Building the UI and plotting the data
With everything in place, we’re ready to start plotting our charts and building a simple interactive page. To begin, open the +page.svelte file under routes. If you started with an empty project, you may need to create this file.
The +page.svelte file defines a page in our app, and since it’s located at the root of the routes directory, it will serve as the main page (or homepage) for our application.
These files support script tags, HTML syntax, and Svelte’s powerful reactivity features.
We’ll begin by adding the code in the script section.
Interactive TradingView Chart
Select CoinSelect Interval (Days)
In this script section, we’re setting up the charting logic and making the page responsive to user input for selecting coins and intervals:
First, we declare data as a prop of type PageData, representing the data we fetched in our +page.server.ts file. Using the $: reactive assignment syntax, we assign chartData to data.chartData. This makes chartData reactive, so any changes will automatically update the chart on the page.
We also define arrays for coins and intervals, allowing users to choose which cryptocurrency and time interval to display. These are simple lists of strings and will populate dropdowns for user selection on the page. Feel free to edit the coins array to suit your preferences.
To update the page without refreshing, we use the updateQueryParams() method. This function captures the selected coin and interval, updates the URL query parameters accordingly, and uses Svelte’s goto function with replaceState: true. This keeps the URL in sync with user selections.
Finally, to handle updates each time chartData or the selected options change, we use the afterUpdate lifecycle hook to recreate the chart with fresh data whenever any input selections are modified.
This setup makes the chart dynamically update as users change options, or as new data becomes available, creating a smooth interactive experience.
Step 6: Test the app
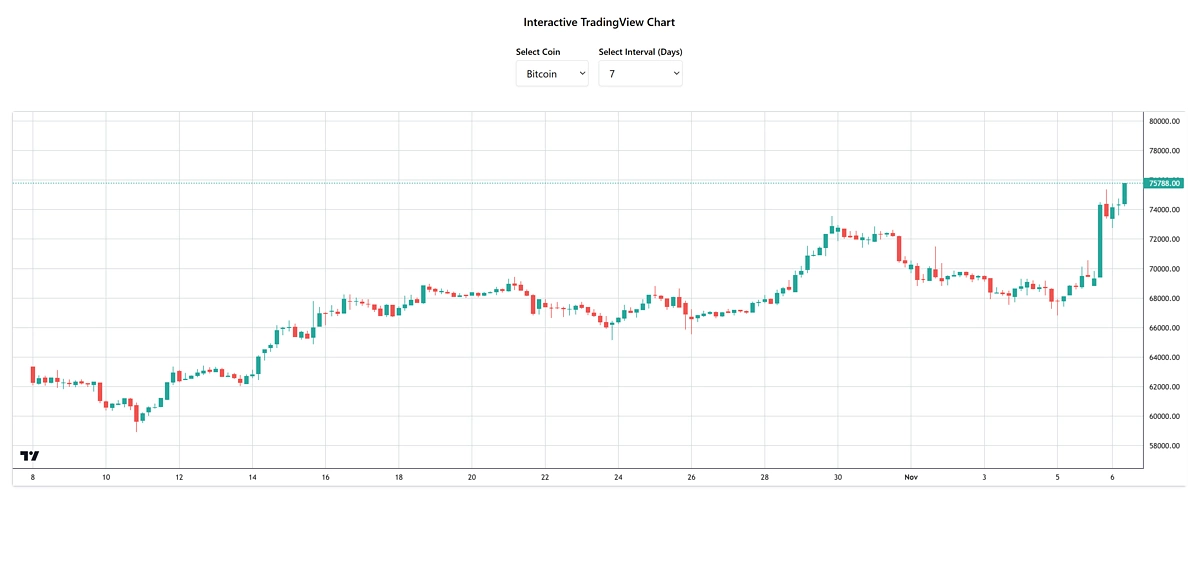
Congratulations - you should now be able to see your work by running npm run dev and navigating to http://localhost:5173/
The page will look something like this:
The page will look something like this:


:quality(75)/2024_4_25_638496031986682940_aesthetic-1.jpg)
0 Comments